
In a nutshell
This time of year, we eagerly await the first sign of leaves or flowers on the plants around us, associating those events with the onset of spring. And we may wonder whether this spring is starting earlier or later than normal. We can answer this question by looking at observations collected on plants. We can also use weather data to answer this question, focusing on the conditions that need to occur for plants to start leafing out or flowering.
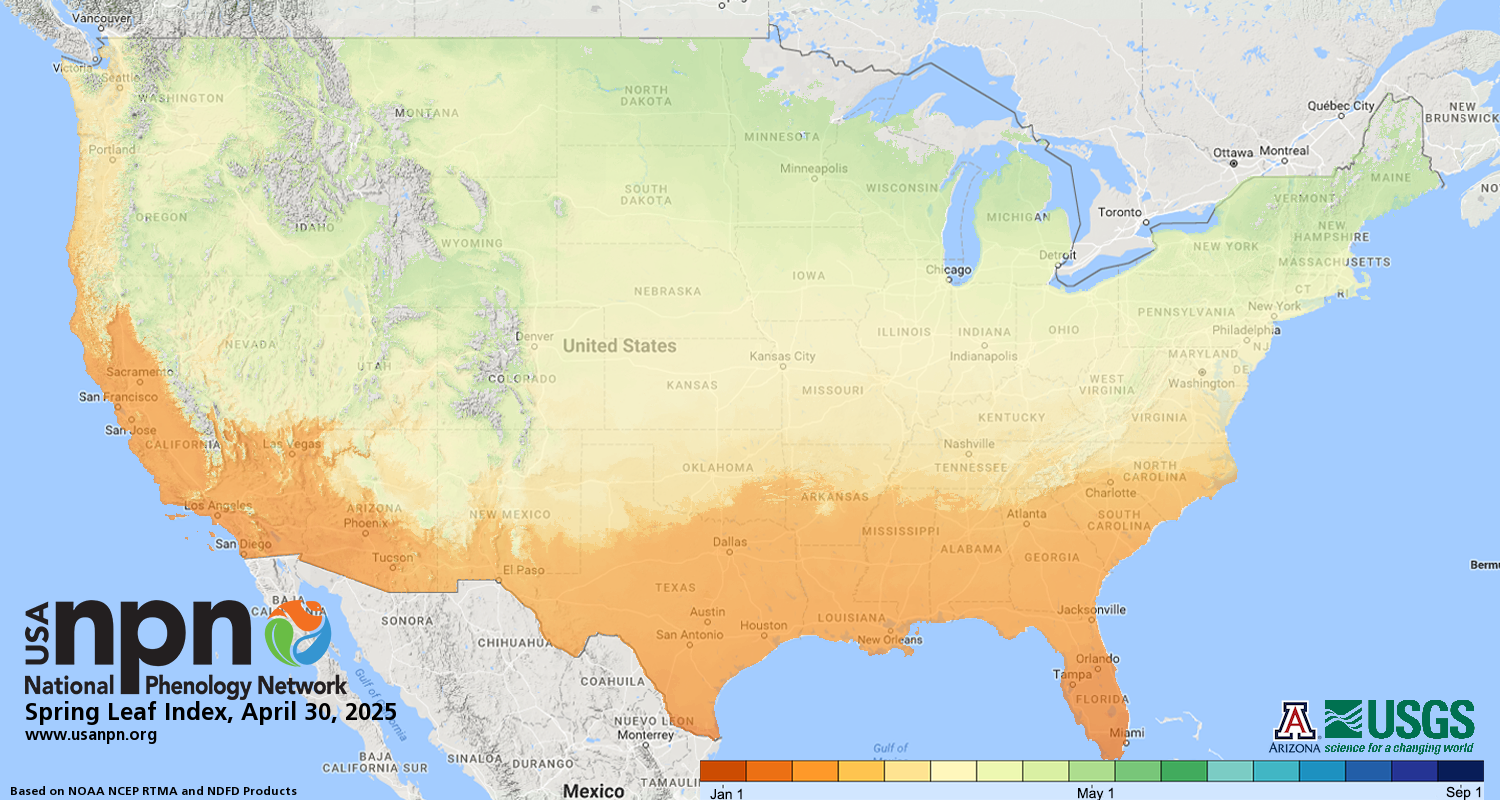
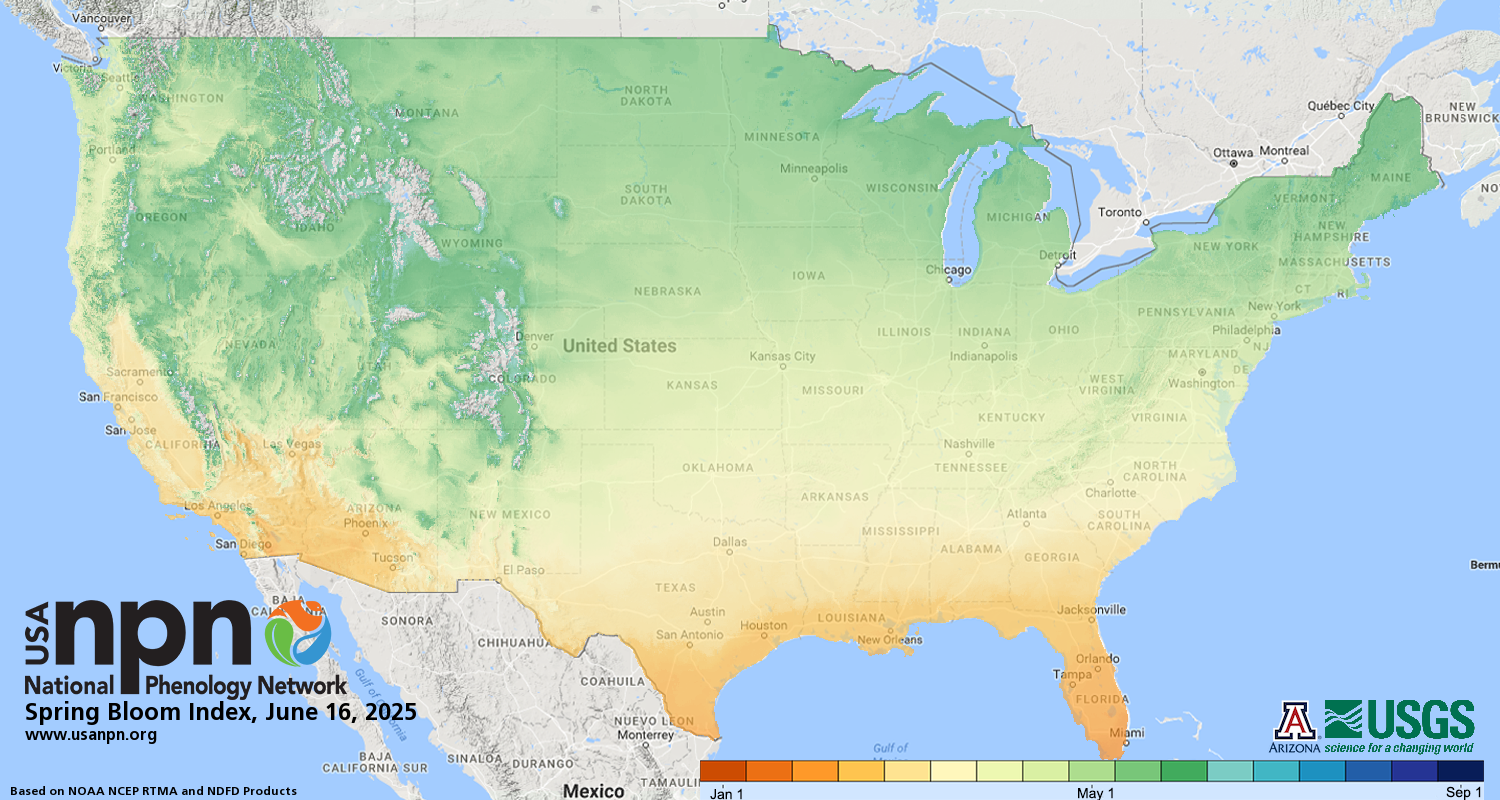
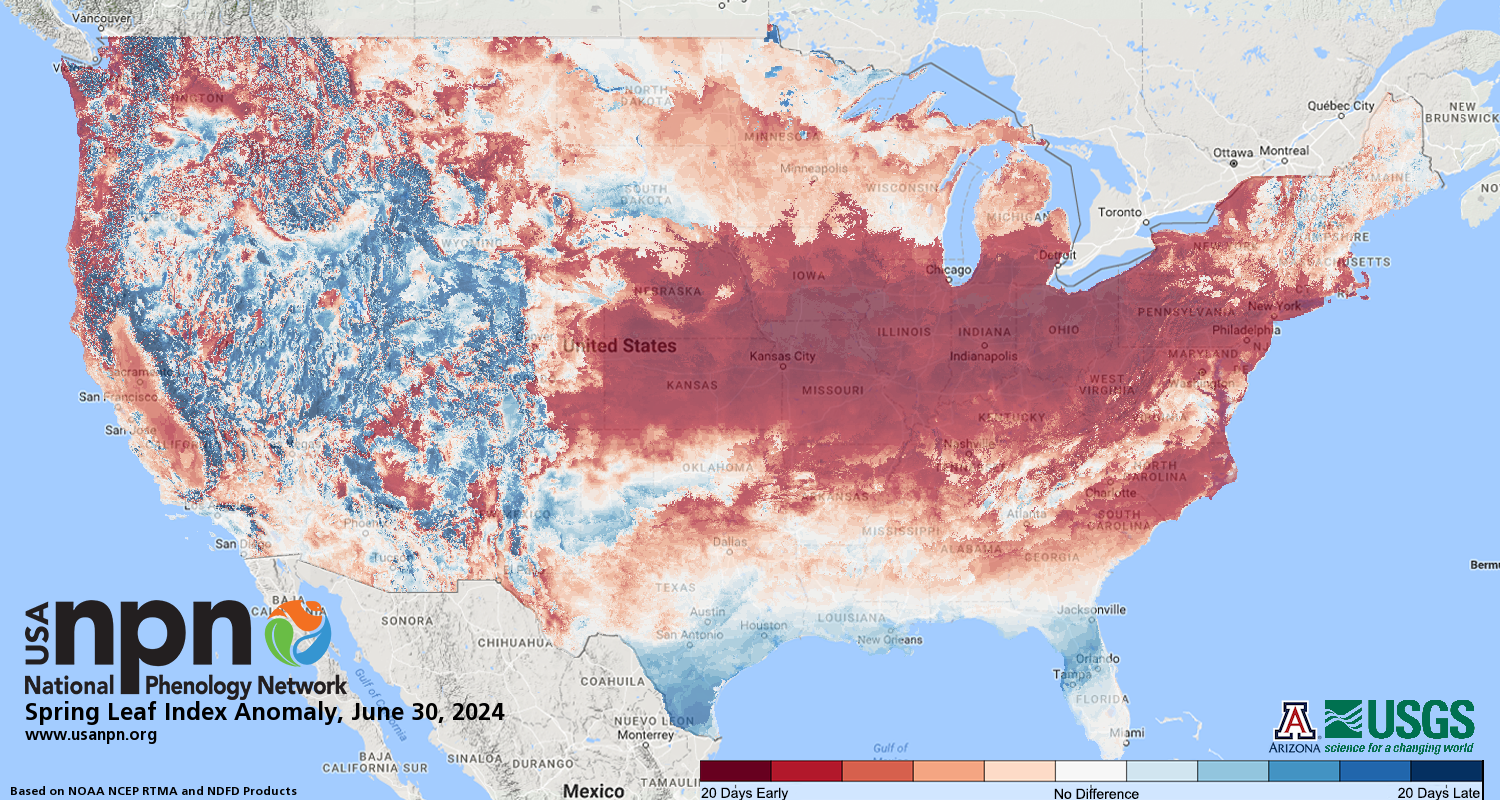
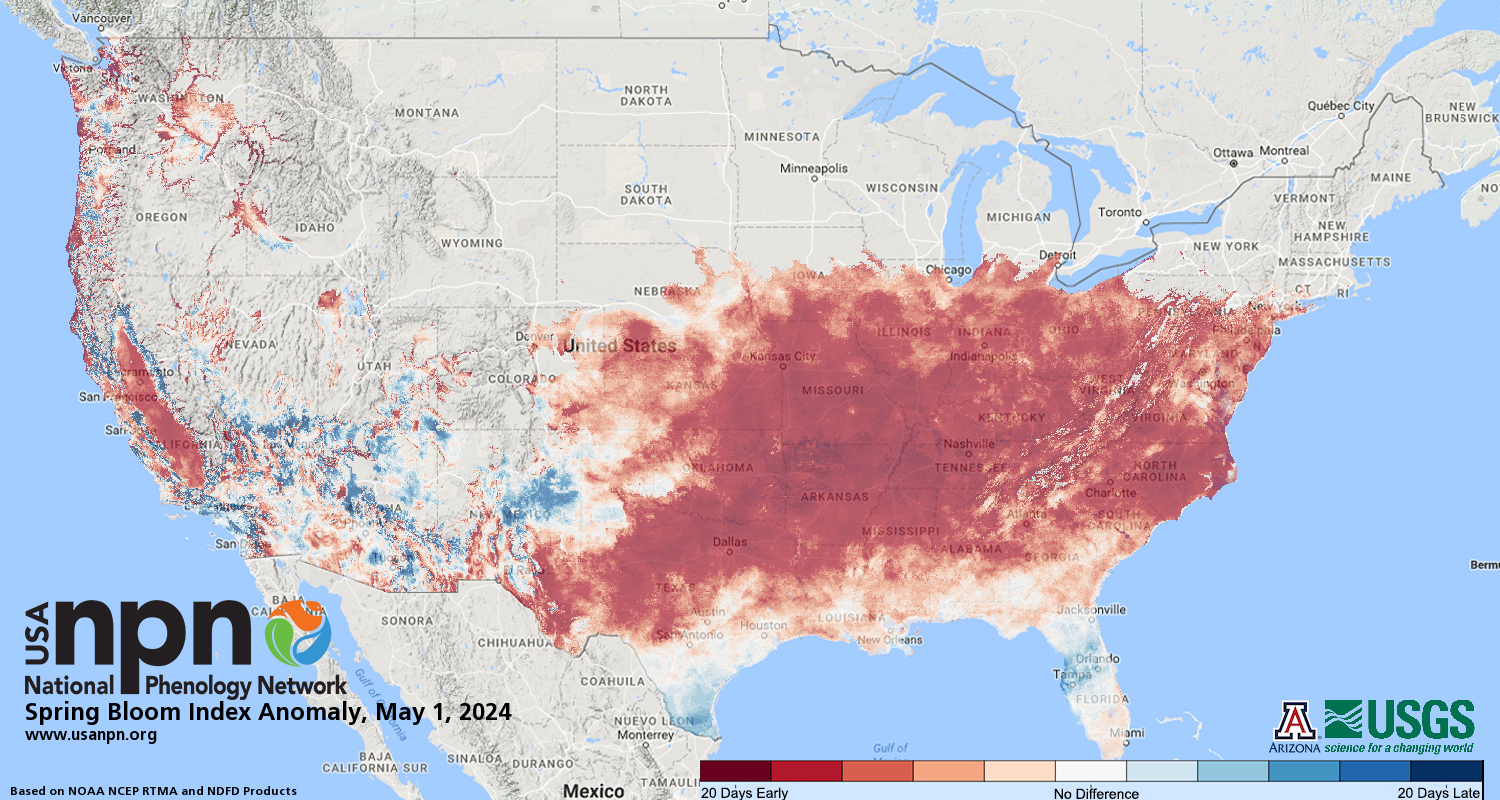
The USA-NPN has long shared maps indicating the start of spring – the Spring Leaf Index and the Spring Bloom Index. These maps reflect when conditions that are associated with the beginning of springtime activity are reached. They are very useful for indicating when conditions are met in the current year as well as whether that timing is earlier or later than usual. We can make that determination by comparing when the conditions were met this year to when those conditions were met in previous years. This is how we produce our Leaf and Bloom “anomaly” maps.
A shortcoming of these maps is that they only capture the beginning of the spring season. An early start to the season doesn’t necessarily mean that all subsequent springtime events will arrive early. And so, a research team set out to construct an additional suite of models that can predict when conditions associated with later-season events are reached.
The team used thousands of observations of first leaves or flowers in many wild species of woody plants submitted to Nature’s Notebook from across the U.S. They developed models for each species that linked the date that leaves or flowers were first observed to spring temperatures and daylength. After grouping species and events that occurred under similar conditions, they were able to create eight new indices that describe moments from “very early leaf out” to “late bloom”. These new indices provide a more comprehensive picture of how spring is progressing each year.
What is special about this study?
The new models developed in this study were only possible because of the incredible breadth and depth of leaf-out and flowering observations contributed by Nature’s Notebook participants over the last 15 years. This work is an example of what can be achieved with phenology observations collected on many species at many sites over many years.
What does this mean for YOU?
Your contributions to Nature’s Notebook are a vital part of this work. Keep an eye out on the USA-NPN Status of Spring website, where maps for the Late Bloom Index, the model that represents the timing of activity in the latest-blooming species, will be added soon.
Citation: Hatzis, J. J., M. D. Schwartz, T. R. Ault, A. Donnelly, A. Gallinat, X. Li, and T. M. Crimmins. 2025. Building spring development indices for woody species in the conterminous United States. Agricultural and Forest Meteorology. https://doi.org/10.1016/j.agrformet.2025.110443